


New ETD Dashboard Supports Shows the Impact of Making Research Widely Available
Here’s what users of the new Electronic Theses & Dissertations Dashboard are saying

By Heather Riccio
Now that the newly launched ProQuest Electronic Theses & Dissertations (ETD) Dashboard has been available to all ProQuest Dissertations & Theses (PQDT) Global contributors for a few months, what value is it bringing to users? We checked in with a few of them to find out.
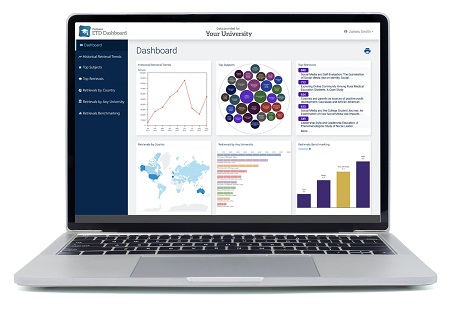
Developed in collaboration with library and graduate school communities, the ETD Dashboard – a 2021 CODiE award finalist – shows institutions a visual representation of their dissertation and theses retrieval trends by category, such as subject, author, country and university. Librarians and administrators can use the data to inform a range of activities, including benchmarking, investment decisions, grant proposal development and even marketing strategies.
At Indiana University, ETD Dashboard data is perfect for measuring the impact of student research. “ETD Dashboard data provides helpful insights on and visualizations of the impact of student research that complements what can be discovered through research published in journals and monographs,” said David Daleke, Vice Provost for Graduate Education and Health Sciences. “I think it will be helpful to see how research, especially what is not yet published in articles or monographs, is being received by the scholarly world.”
The ETD Dashboard has also helped identify trends. This has been a huge benefit for the University of Glasgow, where they’ve recently used the ETD Dashboard to monitor research themes. “At Glasgow, we are focusing on using the ETD Dashboard to monitor usage trends and highlight research themes, but also to provide feedback to our graduate schools using the reporting function,” said William Nixon, Assistant Director for Academic Engagement and the Digital Library.
Need help tracking valuable reach insights? Look at what the University of Liverpool is doing. “I was pleased to see the data on historical retrieval trends – the usage increases we’ve seen since we began submitting full-text works has been surprising and informative. It will assist us in tracking our overall research reach,” said Martin Wolf, Head of Open Research.
And at Cornell University, the unique dashboard is helping universities write stories for their weekly newsletters using the data they collect. “We are developing stories for our graduate student weekly newsletter with some of these data, featuring our alums and their work,” said Jan Allen, Associate Dean for Academic and Student Affairs at Cornell’s graduate school.
The ETD Dashboard gathers retrieval and usage data from 4 million subscribing researchers from 3,100 institutions across 100 countries. It has six distinctive report options for data-driven decision-making. Universities can also use the data to support funding initiatives and grant writing, leverage the comparison data to use in their marketing campaigns, and educate graduate students about the impact of circulating their research to the global research community.
Improved International Analysis
Listening to ETD Dashboard users influences the continued development of the tools and functionality. At the end of June, 2021, new comparison groups will be added to provide more impact for international users.
Benchmarking comparison groups; Russell Group (UK), LERU (Europe), NIRF (India), will be added to list of currently available comparison groups shown today, Carnegie Tiers R1, R2, D/PU, Masters, and Times Higher Ed Top 200.
With everything ETD Dashboard can do, what are you waiting for? Amplify the impact of your research and turn your data into action for real change.
Start using the ETD Dashboard
Visit about.proquest.com/go/etddashsignup or talk to your ProQuest sales specialist today.