New Syndetics Unbound Usage Statistics
We're very pleased to announce a major improvement to our Syndetics Unbound statistics page. Our new usage statistics include deep dives into coverage and interaction statistics, many charts and graphs, a date selector tool, and the ability to limit your view by instance

Syndetics Unbound subscribers can check it out in the Syndetics Unbound Admin, under Statistics.
Some of the metrics we're tracking and displaying now include:
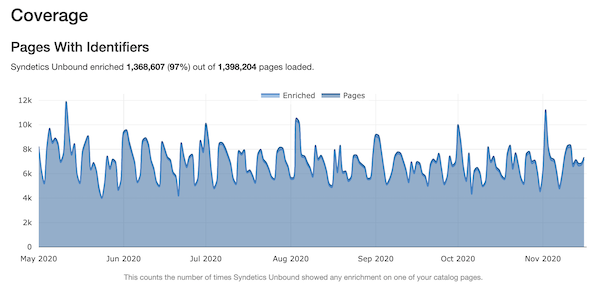
Coverage charts show the number of times Syndetics Unbound showed any enrichment on a catalog page, and as a percentage of all catalog pages loaded.
Many libraries will also notice significant improvements in your coverage percentages. Our previous statistics were based on all "pages hit," including pages Syndetics Unbound could never enhance. The new statistics are based on "pages with identifiers"—meaning ISBNs, ISSNs, UPCs and EANs. This gives a truer picture of Syndetics Unbound's ability to enhance your library's holdings.
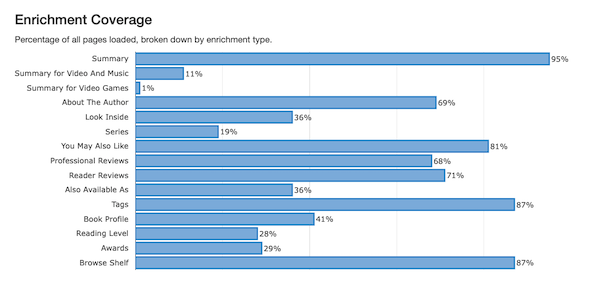
Enrichment coverage shows how often each element displays. If Summary is 95%, that means that 95% of the time that an item page is loaded, it will include a summary.
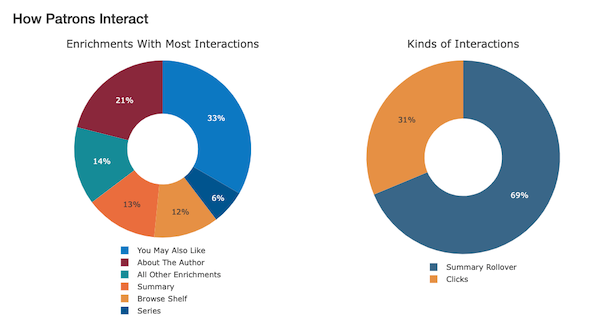
Interactions break down which enrichments are interacted with the most, and how. Included in the interactions number is: hovering on covers to read summaries, clicking "read more" to expand text, opening lightboxes, clicking within lightboxes, and clicking on "Check Availability" to navigate to a new bib page.
We've also made a screencast overview to explain the new stats, here.
Suggestions? Questions? Concerns? We want to hear from you. Please reach out to us at bowker.technicalsupport@proquest.com.
For more information about Syndetics Unbound, please visit Syndetics.com.